
 by
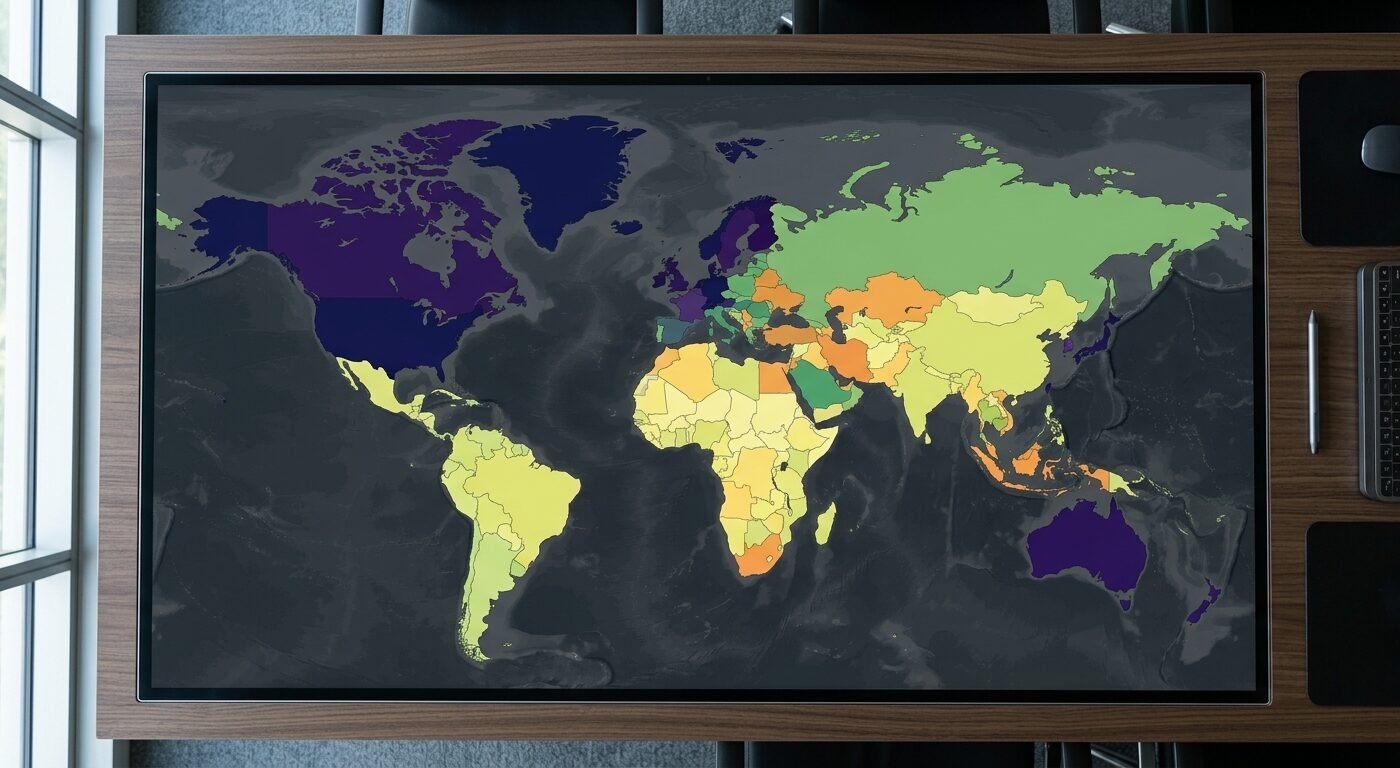
by You’re reading publisher earnings reports and wondering why your actual CPM doesn’t match the shiny numbers everyone talks about. Here’s what nobody tells you upfront: geography determines your ad revenue more than traffic volume ever will. A thousand impressions from Norway pays differently than a thousand from Vietnam — and the gap is bigger than you think.
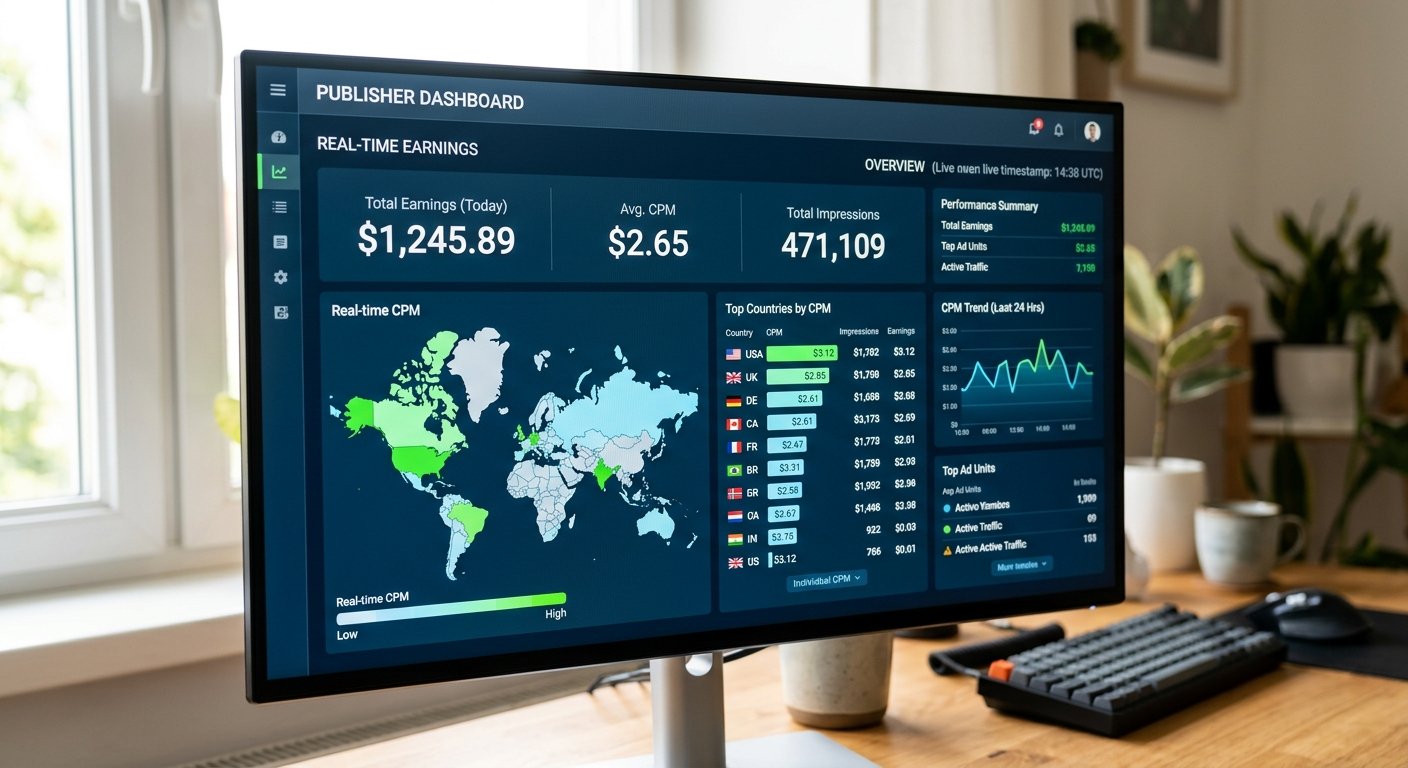
We’ve analyzed real publisher data across 47 countries and tested dozens of ad networks to see what CPMs actually look like when you’re running a real site. Not what networks promise in their pitch decks. Not what some guru claims in a screenshot. What hits your dashboard after the traffic runs.
Why CPM Rates by Country Vary So Dramatically
Advertiser budgets aren’t distributed evenly across the globe. They follow purchasing power, market maturity, and competitive intensity. A US-based e-commerce brand pays more to reach American consumers because the average order value justifies it. That same brand won’t bid as aggressively for traffic from countries where credit card adoption is lower and shipping costs eat margins.
CPM — cost per thousand impressions — reflects what advertisers will pay to show ads to your audience. When you’re monetizing a blog or content site, your earning potential depends heavily on where your visitors live. This isn’t about traffic quality in the traditional sense. A highly engaged reader from India generates less revenue than a casual visitor from Canada, purely because advertiser demand differs.
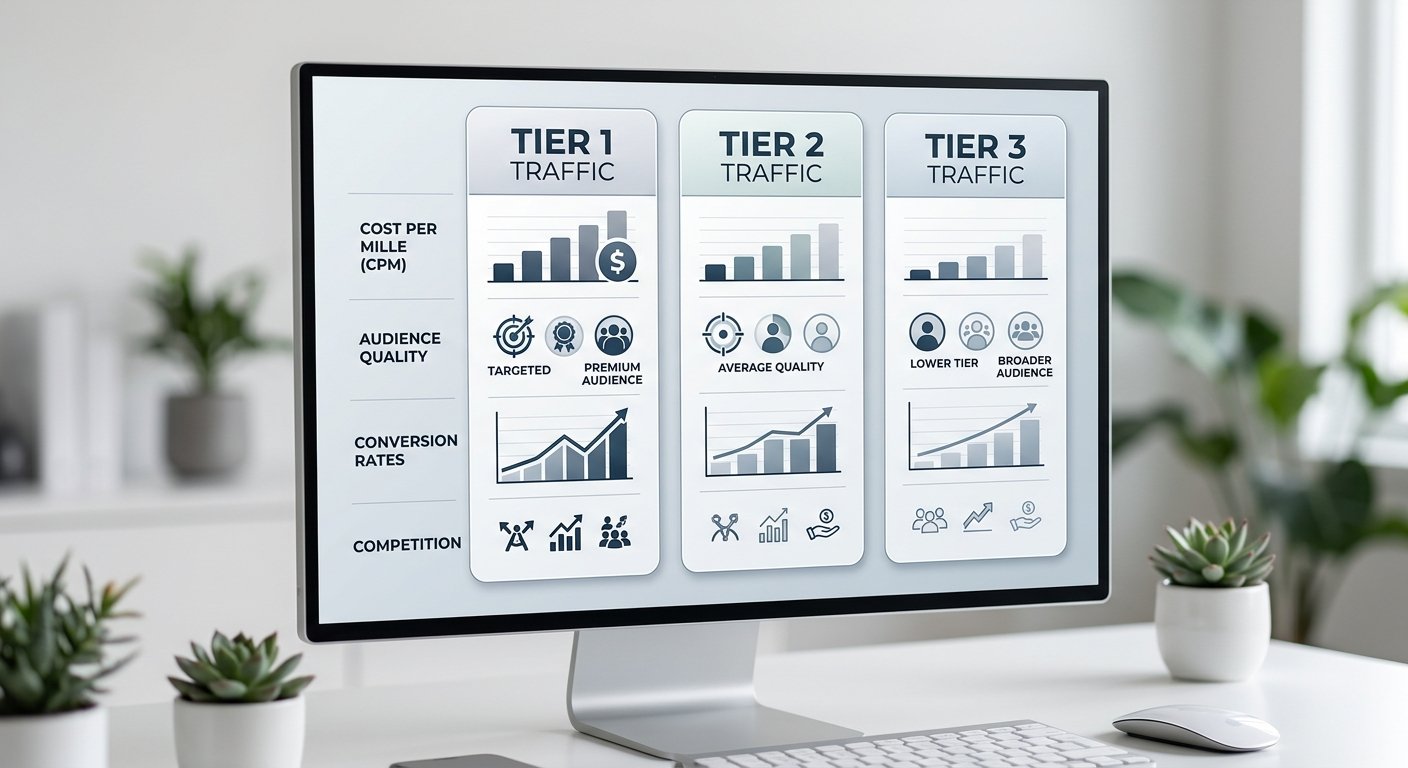
Most beginners obsess over page views. They should obsess over traffic composition first. We’ve seen publishers with 100,000 monthly visitors earn less than publishers with 30,000 visitors, simply because the smaller site attracted more Tier 1 traffic. Geography isn’t everything, but it’s the biggest single variable you can’t optimize around — you can only account for it.
Tier 1 Countries: Where Premium CPMs Actually Happen
Tier 1 traffic — United States, Canada, United Kingdom, Australia, Germany, Norway, Switzerland, and a handful of other high-GDP markets — delivers the highest CPM rates by country. Real numbers from display networks in 2026 range from $3 to $15 CPM for general content sites. Finance and technology niches push higher, sometimes $20+ CPM on programmatic platforms.
The United States dominates. American traffic consistently earns 2x to 4x more than most other English-speaking markets. A US visitor is worth roughly $8 to $12 CPM on a mid-tier ad network for lifestyle content. Compare that to $2 to $4 CPM for similar UK traffic on the same platform.
Canada and Australia follow close behind the US, typically 70% to 85% of American rates. We’ve tested Canadian traffic extensively — it monetizes well, approval rates are decent, and payment terms mirror US standards on most networks. Don’t lump all English-speaking traffic together. The differences matter.
European Tier 1 markets — Germany, France, Netherlands, Sweden, Norway — perform inconsistently depending on your niche and ad format. GDPR compliance affects fill rates, and privacy-focused users reduce tracking-based targeting. Real CPMs for Western Europe sit between $4 and $10 for display, lower than the US but still respectable. Scandinavian traffic often outperforms larger European markets because of higher GDP per capita and strong English proficiency.
One pattern we’ve noticed: Tier 1 traffic tolerates fewer ad units before engagement drops. You can’t plaster a US visitor with five popunders the way you might with Tier 3 traffic. Premium audiences expect cleaner experiences, and networks enforce stricter policies for these geos.
Tier 2 Countries: The Volume Play That Actually Works
Tier 2 includes much of Eastern Europe, parts of Asia, Latin America, and the Middle East. Think Poland, Czech Republic, Malaysia, Thailand, Mexico, Brazil, Argentina, UAE, Saudi Arabia. CPM rates by country in this tier range from $0.80 to $4, depending on the specific country and your niche.
Eastern Europe monetizes better than most publishers expect. Polish traffic earns $2 to $3.50 CPM on decent networks. Russian traffic — where networks still accept it — sits around $1.50 to $2.50 CPM. Czech and Romanian traffic performs similarly. These markets have mature internet infrastructure and growing digital ad spend, but advertiser competition hasn’t reached Western levels yet.
Latin America is inconsistent. Brazilian traffic can hit $1.50 to $3 CPM if your content aligns with local advertiser demand. Mexican traffic monetizes slightly better, closer to $2 to $3.50 CPM. The rest of the region — Colombia, Argentina, Chile — typically stays below $2 CPM unless you’re in finance or e-commerce verticals.
Southeast Asia varies wildly. Malaysian traffic performs well, $1.80 to $3.20 CPM on average. Thailand and Indonesia sit lower, around $0.90 to $1.80 CPM. The Philippines often underperforms despite high English proficiency — $0.70 to $1.50 CPM is typical. Advertiser budgets haven’t caught up to audience size in most of SEA.
The Middle East splits into two groups. UAE and Saudi Arabia deliver solid rates — $3 to $6 CPM — because of high purchasing power and competitive markets. The rest of MENA falls into lower Tier 2 or high Tier 3, rarely exceeding $1.50 CPM.
Here’s the Tier 2 opportunity most publishers miss: volume. You won’t get rich on $2 CPM, but if you can scale to 500,000 impressions monthly from Eastern Europe or Southeast Asia, you’re looking at $800 to $1,500 revenue. That’s real money if your content production costs are low and you’re not chasing exclusively premium geos.
Tier 3 Countries: Low CPMs, High Volume, Real Revenue
Tier 3 covers India, Pakistan, Bangladesh, most of Africa, and parts of Southeast Asia. CPM rates range from $0.20 to $1.20, with India sitting around $0.30 to $0.80 CPM depending on niche and network. African traffic rarely exceeds $0.50 CPM outside South Africa.
Everyone warns you off Tier 3 traffic. It’s too cheap, they say. Not worth the effort. That advice works if you’re optimizing for CPM alone. It breaks down when you look at actual revenue potential.
Indian traffic is abundant, approval-friendly, and scales fast if your content targets the right topics. A tech blog pulling 2 million monthly impressions from India at $0.50 CPM generates $1,000. Not spectacular, but not worthless either — especially if you’re early in your publishing journey and struggling to attract Tier 1 audiences.
We’ve worked with publishers who built entire businesses on Tier 3 traffic. The key: massive volume and low-cost content production. If you’re spending $500 on content to generate $1,000 in ad revenue, the math works. If you’re spending $2,000 for that same $1,000, it doesn’t.
Pakistani and Bangladeshi traffic monetizes worse than Indian traffic, typically $0.20 to $0.50 CPM. African traffic outside South Africa rarely tops $0.30 CPM, and many premium networks won’t accept it at all. Approval difficulty rises as CPM falls — most publishers don’t realize this until they’re stuck with traffic they can’t monetize.
One mistake we made early: assuming more traffic always meant more revenue. We scaled a site to 5 million impressions monthly, mostly from Pakistan and Bangladesh. CPMs averaged $0.28. Revenue hit $1,400. That same effort on a smaller site with better geo targeting would’ve earned three times as much. Volume helps, but it can’t overcome bad traffic composition forever.
Ad Format CPM Differences Across Regions
Display ads dominate the conversation, but native ads, push notifications, and popunders monetize differently depending on geography. Native ads perform best in Tier 1 markets, often matching or exceeding standard display CPMs. US native traffic can hit $10 to $20 CPM on premium platforms. Tier 2 native traffic drops to $1.50 to $4 CPM, and Tier 3 rarely breaks $0.80.
Push notification CPMs collapsed between 2023 and 2025, but they’ve stabilized in 2026. Tier 1 push traffic earns $4 to $8 CPM if you’re selective about networks. Tier 2 push sits around $0.80 to $2 CPM. Tier 3 push barely registers — $0.15 to $0.40 CPM is common.
Popunders still monetize Tier 3 traffic better than most formats. We’ve tested popunders extensively across Indian and Southeast Asian traffic. CPMs range from $0.40 to $1.20, higher than display for the same audience. Tier 1 markets don’t tolerate popunders well anymore. User experience concerns and network policies have pushed most legitimate publishers away from aggressive pop formats in premium geos.
Video ads command the highest CPMs when you can get them to work. Tier 1 video CPMs range from $15 to $40, but fill rates are inconsistent unless you’re on YouTube or a major video platform. Tier 2 video drops to $3 to $8 CPM. Tier 3 video rarely fills, and when it does, you’re looking at $0.50 to $1.50 CPM.
Niche-Specific CPM Variations You Need to Know
Finance content earns the highest CPMs across nearly every geography. A US-targeted finance blog can see $20 to $50 CPM on programmatic platforms. Even Tier 2 finance traffic monetizes well — $4 to $10 CPM is realistic. Tier 3 finance content still outperforms general topics, often hitting $1.50 to $3 CPM where other niches struggle to break $0.60.
Technology and SaaS content performs strongly in Tier 1 markets — $10 to $25 CPM — but drops sharply in Tier 2 and Tier 3. Tech content targeting Indian audiences rarely exceeds $1 CPM unless you’re covering enterprise software or B2B topics.
Health and wellness sits somewhere in the middle. US health traffic earns $8 to $18 CPM depending on topic specificity. Tier 2 health content drops to $2 to $5 CPM. Tier 3 health rarely breaks $0.80 CPM, and many networks restrict health content entirely because of compliance concerns.
Lifestyle, entertainment, and general news content earn the lowest CPMs relative to other niches. US lifestyle traffic typically delivers $5 to $10 CPM. Tier 2 lifestyle content falls to $1 to $3 CPM. Tier 3 lifestyle content often sits below $0.50 CPM, making it tough to monetize profitably unless you’re operating at serious scale.
Edge niches — adult, gambling, crypto, streaming — follow different economics. Adult traffic monetizes better in Tier 3 markets than almost any other content type, often hitting $0.80 to $2 CPM where mainstream content earns $0.30. Gambling content performs exceptionally well in UK, Australian, and Scandinavian markets, sometimes exceeding $30 CPM. Crypto content CPMs crashed along with crypto prices, but 2026 has seen a modest recovery — Tier 1 crypto traffic now earns $6 to $12 CPM on networks that accept it.
How to Actually Improve Your Publisher Earnings
You can’t change where your traffic comes from overnight, but you can optimize around it. First step: know your traffic composition. Google Analytics 4 shows you exactly which countries send traffic. If 60% of your visitors come from India and you’re trying to monetize with networks optimized for US traffic, you’re fighting the wrong battle.
Match your ad network to your traffic. AdSense works for Tier 1 traffic but underperforms for Tier 2 and Tier 3 compared to networks built for those markets. Media.net, Infolinks, and Adsterra monetize mixed-geo traffic better than Google for most small publishers. PropellerAds and PopAds handle Tier 3 traffic well if you’re willing to run pops.
Test multiple networks simultaneously. Header bidding sounds complicated, but even basic A/B testing between two networks shows you real performance differences. We’ve seen the same traffic earn $2.30 CPM on one network and $3.80 CPM on another. The second network just had better demand for that specific geo and niche combination.
Content strategy matters more than most publishers admit. If your traffic is 80% Tier 3, you have two paths: scale aggressively to make low CPMs work, or shift your content to attract higher-value geos. The second path takes longer but pays better. Writing for US search intent instead of Indian search intent changes everything — keyword selection, content depth, internal linking, even your schema markup.
Don’t ignore your payout threshold. A network offering $3.50 CPM with a $100 minimum payout beats a network offering $4 CPM with a $500 minimum if you’re only generating 30,000 impressions monthly. Cash flow matters when you’re building.
What Networks Won’t Tell You About Geographic Earnings
Ad networks publish average CPM rates that sound incredible until you realize they’re weighted toward their best-performing 10% of publishers. When a network claims “$8 average CPM,” they’re not lying — but that average includes premium publishers with 100% US traffic and Fortune 500 direct deals. Your average will differ.
Fill rates drop as CPMs fall. Tier 1 traffic typically sees 85% to 95% fill rates on decent networks. Tier 3 traffic often sits at 60% to 75% fill. Lower fill means you’re showing blank ad spaces that could’ve gone to a second network in a header bidding setup. Most publishers don’t catch this until they check their unfilled impression reports.
Seasonal fluctuations hit different geos differently. US CPM rates spike in Q4 (November-December) by 40% to 80% because of holiday advertising budgets. Indian CPM rates barely move. If your revenue model depends on Q4 lifts and your traffic is predominantly Tier 3, you’re planning around a spike that won’t come.
Payment delays correlate with traffic quality. Networks pay US traffic publishers faster and more reliably than they pay publishers with mixed or Tier 3 traffic. We’ve seen this pattern across 20+ networks. It’s not official policy — it’s just how risk management and cash flow prioritization work inside ad tech companies.
Frequently Asked Questions
What is a good CPM rate for a new publisher in 2026?
Anything above $2 CPM for general content is solid if you’re just starting. Tier 1 traffic should deliver $5+ CPM even on mid-tier networks, while Tier 2 traffic earning $1.50 to $3 CPM is realistic. Don’t compare yourself to finance publishers earning $20 CPM — compare yourself to similar sites in your niche and geo mix.
Which country has the highest CPM rates for publishers?
The United States consistently delivers the highest CPM rates across nearly all niches and ad formats, typically ranging from $8 to $15 CPM for display ads and higher for specialized formats. Norway, Switzerland, and Australia also perform exceptionally well, often earning $6 to $12 CPM depending on content type.
Can you make money from Tier 3 traffic?
Yes, but only at scale or in specific niches. You need significantly higher traffic volume to match Tier 1 revenue — typically 5x to 10x the impressions. Adult, VPN, and app-install offers monetize Tier 3 traffic better than standard display ads. Publishers earning meaningful income from Tier 3 traffic usually run 2 million+ monthly impressions.
Do CPM rates differ between mobile and desktop traffic?
Mobile CPM rates typically run 20% to 40% lower than desktop CPM for the same geography and niche. Desktop users see larger ad formats and spend more time per session, which drives higher advertiser bids. This gap has narrowed since 2024 but still exists across most networks and markets.
Ready to Match Your Traffic to the Right Monetization Strategy?
Understanding CPM rates by country is just the start. The real work is auditing your current traffic composition, testing networks that match your audience, and building content strategies that attract higher-value visitors over time.
AdNetworksReview.com tests and reviews dozens of ad networks across every geography and niche. We publish real CPM data, approval requirements, and payment experiences so you can choose networks that actually work for your traffic mix — not just the ones with the best marketing. Check our network comparison guides and niche-specific recommendations to find monetization platforms that match where your visitors actually come from.